2010-2011 National Survey on Drug Use and Health: Other Sources of State-Level Data
Introduction
A variety of surveys and data systems other than the National Survey on Drug Use and Health (NSDUH) collect data on substance use and mental health problems. It is useful to consider the results of these other studies when discussing NSDUH data. This document briefly describes one of these other data systems that publish State estimates, presenting selected comparisons with NSDUH results. The State-level survey that collects data on substance use discussed in this document is the Behavioral Risk Factor Surveillance System (BRFSS), sponsored by the Centers for Disease Control and Prevention (CDC). Another CDC data system that provides State-level substance use estimates for most but not all States is the Youth Risk Behavior Survey (YRBS). Differences between the YRBS and NSDUH sampling designs, and age groups used in NSDUH small area estimates, imply that comparisons of prevalence rates are not straightforward. However, ignoring these differences and examining estimates at a national level, the YRBS has been generally shown to have higher prevalence rates but similar long-term trends compared with NSDUH (Center for Behavioral Health Statistics and Quality [CBHSQ], 2012).1
When considering the information presented in this document, it is important to understand the methodological differences between these surveys and the impact that these differences could have on estimates of substance use. Several studies have compared NSDUH estimates with estimates from other studies and have evaluated how differences may have been affected by differences in survey methodology (Brener et al., 2006; Gfroerer, Wright, & Kopstein, 1997; Grucza, Abbacchi, Przybeck, & Gfroerer, 2007; Hennessy & Ginsberg, 2001; Miller et al., 2004). These studies suggest that the goals and approaches of surveys are often different, making comparisons between them difficult. Some methodological differences that have been identified as affecting comparisons include populations covered, sampling methods, mode of data collection, survey setting, questionnaires, and estimation methods.
BRFSS is a State-based system of health surveys that collect information on health risk behaviors (including cigarette and alcohol use), preventive health practices, and health care access primarily related to chronic disease and injury. BRFSS is an annual, State-based telephone (landline and cellular telephone) survey of the civilian, noninstitutionalized adult population aged 18 or older and is sponsored by the CDC. In 2011, BRFSS collected data from all 50 States, the District of Columbia, Puerto Rico, the U.S. Virgin Islands, and Guam using a computer-assisted telephone interviewing (CATI) design. More than 450,000 adults are interviewed each year. State estimates are presented on a yearly basis.
New in 2011 to BRFSS was the introduction of two methodological changes: (1) the inclusion of cellular telephone-only households in the sample, and (2) the incorporation of iterative proportional fitting (also referred to as "raking") in the production of the final BRFSS weights, replacing the use of poststratification. Cellular telephone-only households were added to improve survey coverage of the telephone population and addressed differences in characteristics found between cellular telephone-only and landline populations. Raking incorporates the desired population variables one at a time in an iterative process rather than making adjustments in a single process. As a result, more variables can be used in raking versus poststratification. In addition to the standard demographic variables of age, gender, race, and ethnicity within each State, BRFSS included education level, marital status, renter or owner status, and source of telephone (cellular telephone only, landline only, cellular and landline). As a result of these methodological changes, the CDC has reported small increases in various health risk indicators, including tobacco use and binge drinking. The 2011 BRFSS State prevalence rates and confidence intervals are weighted design-based estimates (i.e., each respondent is weighted in a way that accounts for the survey design).2
Also in 2011, the BRFSS questionnaire underwent some changes in the alcohol consumption and tobacco use sections. In 2010, BRFSS respondents were asked, "During the past 30 days, have you had at least one drink of any alcoholic beverage such as beer, wine, a malt beverage or liquor?" The response to this question was used to route respondents to the next question regarding the frequency of alcohol use in the past 30 days. However, only the responses to the first question were used to determine past month alcohol use. In the 2011 BRFSS questionnaire, this question was dropped, and respondents were directly asked, "During the past 30 days, how many days per week or per month did you have at least one drink of any alcoholic beverage such as beer, wine, a malt beverage or liquor?" If a respondent answered "1" or higher to this question, he or she was considered a past month user of alcohol. In spite of the questionnaire changes, BRFSS is still producing an estimate of past month alcohol use that can be compared with the NSDUH estimate. There were also minor wording changes in one question, in the tobacco use section, but none of these would affect current cigarette use rates.
There are three substance use measures for which estimates are produced for both BRFSS and NSDUH in each of the 50 States and the District of Columbia:3
past month alcohol use,
past month binge alcohol use, and
cigarette use ("past month" use for NSDUH and "current" use for BRFSS).
Past month alcohol use is defined consistently in both BRFSS and NSDUH as having an alcoholic beverage in the past month. In NSDUH, past month cigarette use is defined as having smoked part or all of a cigarette during the past 30 days. In BRFSS, the cigarette use measure reported is current cigarette use, which is defined as having smoked at least 100 cigarettes during the lifetime and indicating smoking every day or some days at the time of the survey. Because of these subtle but present differences in definitions, the NSDUH cigarette use estimates tend to be higher in that they catch two groups of people that the BRFSS estimates would not: (1) respondents who have not smoked 100 cigarettes in their lifetime but had smoked in the past month, and (2) respondents who had smoked a cigarette earlier in the month but were not smoking at the time of the survey. Lastly, both surveys ask about binge alcohol use in the past month. The definition for binge alcohol use in NSDUH is having had five or more drinks of an alcoholic beverage on the same occasion (i.e., at the same time or within a couple hours of each other) on at least 1 day in the past 30 days. In BRFSS, women are asked about drinking four or more drinks on one occasion, whereas men are asked about drinking five or more drinks on one occasion.
This documnt presents the findings of the 2011 BRFSS State estimates and the combined 2010-2011 NSDUH State estimates for past month alcohol use and cigarette use ("past month" use for NSDUH and "current" use for BRFSS). In Tables 1 and 2 (shown after this text discussion), the 2011 BRFSS State estimates for adults aged 18 or older are shown alongside the pooled 2010-2011 NSDUH small area estimates for the same age group (by combining the 18 to 25 and 26 or older age groups). Table 1 also includes p values that indicate whether the BRFSS and NSDUH estimates are significantly different from each other for a given State using an exact test as described in the next section. Because the definitions for binge alcohol use in the two surveys are different for women, no comparison of binge alcohol use was done.
Methodology for Comparing BRFSS and NSDUH Estimates
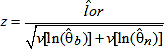
The methodology used to compare BRFSS and NSDUH estimates is similar to what is described in Section B.12 of the 2010-2011 NSDUH: Guide to State Tables and Summary of Small Area Estimation Methodology.4 Here, the null hypothesis of no difference is tested, that is, (where is a State-specific BRFSS direct prevalence rate and is a State-specific NSDUH model-based prevalence rate) or equivalently that the logs-odds ratio is zero, that is, , where is defined as , where ln denotes the natural logarithm. An estimate of is given by , where and are the 2011 BRFSS State estimates and the 2010-2011 NSDUH State estimates, respectively (as given in Tables 1 and 2). To compute the variance of that is, let and , then . The covariance term can be assumed to be zero because the BRFSS and NSDUH samples are independent.
The quantity can be obtained by using the 95 percent Bayesian confidence intervals in Tables 1 and 2. For this purpose, let denote the 95 percent Bayesian confidence interval for a given State-s:
The quantity can be obtained by using the 95 percent confidence intervals in Tables 1 and 2. For this purpose, let denote the 95 percent confidence intervals for a given State-s. Using the first-order Taylor series approximation, the variance can be calculated as follows:
The p value that is given in Tables 1 and 2 for testing the null hypothesis of no difference () is provided by where Z is a standard normal random variate, , and denotes the absolute value of z.
Alcohol Use
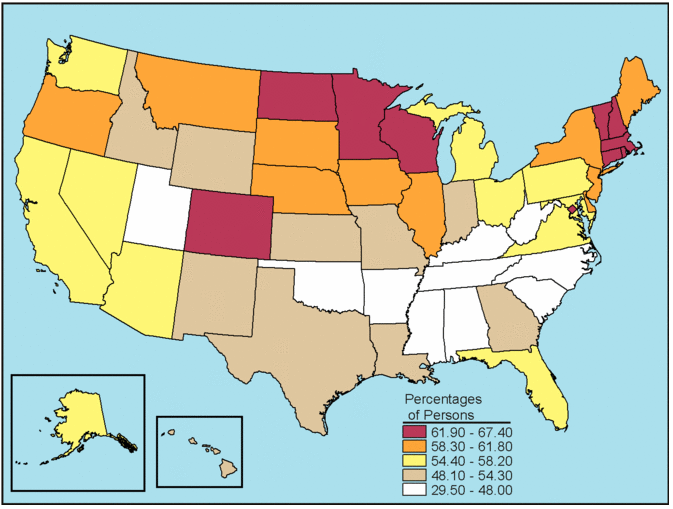
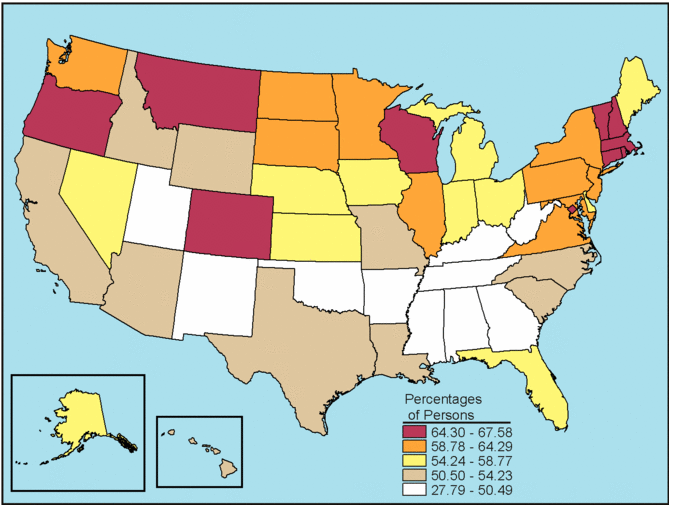
As can be seen in Table 1, for past month alcohol use, the NSDUH and the BRFSS estimates for about a fifth of the States were different (i.e., at the 5 percent level of significance, 12 of 51 States were different). These estimates were also highly correlated (correlation coefficient = 0.94). Figures 1 and 2, which follow the tables, were created by using State estimates from both BRFSS and NSDUH and categorizing the States into five quintiles similar to the process described on the title page of the 2010-2011 NSDUH National Maps of Prevalence Estimates, by State.5 Note that in Tables 1 and 2, the BRFSS estimates and corresponding confidence intervals are rounded to one decimal place, whereas the NSDUH small area estimates and Bayesian confidence intervals are rounded to two decimal places. Therefore, all of the tables and maps included in this document use that approximation.
As can be seen in Figures 1 and 2, 8 out of 10 States with the highest rates of alcohol use (States shown in red) were the same in the two surveys: Colorado, Connecticut, District of Columbia, Massachusetts, New Hampshire, Rhode Island, Vermont, and Wisconsin. The lowest rate of past month alcohol use was in Utah for both the BRFSS survey and NSDUH (see Table 1 and Figures 1 and 2).
Cigarette Use
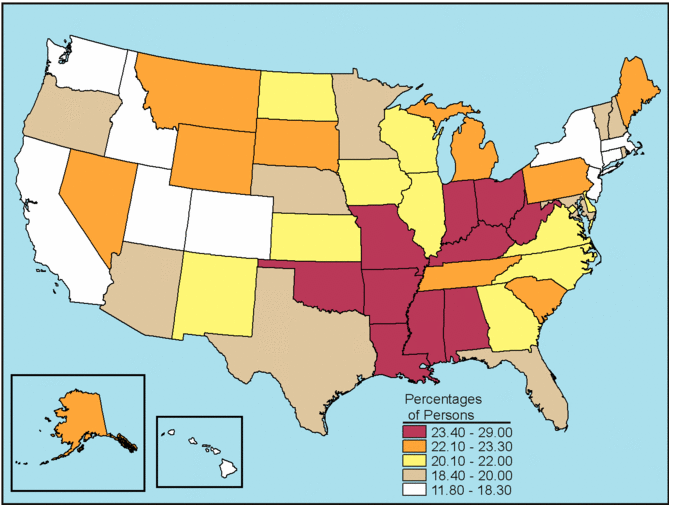
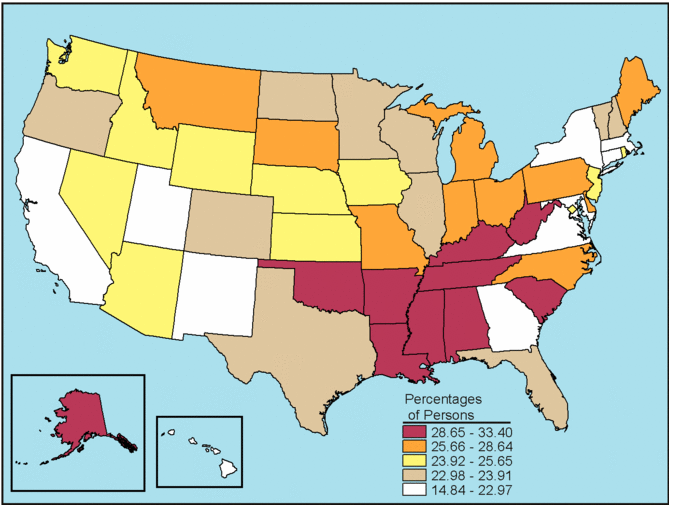
As can be seen in Table 2, the NSDUH estimates of past month cigarette use were always larger than the BRFSS estimates of current cigarette use. Some of this difference is the result of the differences in definitions as discussed earlier in this document; thus, exact tests to examine significant differences between the NSDUH and BRFSS cigarette use estimates are not included. The 2011 BRFSS estimates for current smokers were reported to be higher than in previous years due to the methodological changes introduced (i.e., the addition of cellular telephone-only households and the raking procedure). Although the NSDUH estimates tended to be larger, these two sets of estimates were highly correlated (correlation coefficient = 0.89).
Figures 3 and 4 were created using the same method used to produce Figures 1 and 2. As can be seen in Figures 3 and 4, 7 out of 10 States with the highest rates of cigarette use (States shown in red) were the same in the two surveys: Alabama, Arkansas, Kentucky, Louisiana, Mississippi, Oklahoma, and West Virginia. The lowest rate of cigarette use for both surveys occurred in Utah (see Table 2).
Sample Size Comparisons
The BRFSS estimates are design based, while the NSDUH estimates are model based. Also, the NSDUH estimates are based on the pooled 2010-2011 NSDUHs (2 years of data), whereas the BRFSS estimates are based on the 2011 BRFSS survey (1 year of data). Although the BRFSS estimates are only based on 1 year of data, the BRFSS sample sizes for a given State are in general much larger than the sample sizes for NSDUH over 2 years. The eight "large" States6 have a sample size for those aged 18 or older of approximately 4,800 respondents each for the 2010-2011 combined NSDUH data. In 2010-2011, the 18 or older sample sizes in these States ranged from 4,081 to 5,029.7 For the 2011 BRFSS, all States had larger sample sizes as compared with the NSDUH data. Overall, the BRFSS sample sizes for the eight large States varied from a low of 5,475 respondents in Illinois to a high of 18,004 respondents in California, with a median sample size of 11,279.8 For the remaining 43 small sample States, NSDUH's 18 or older sample size for the combined 2010-2011 data was approximately 1,200 respondents for each State. The BRFSS sample sizes for the small sample States were much larger, varying from a low of 3,543 respondents in Alaska to a high of 25,416 respondents in Nebraska, with a median sample size of 7,689. Sample size differences of this magnitude explain why the NSDUH Bayesian confidence intervals were generally wider than the corresponding BRFSS design-based confidence intervals.
References
Brener, N. D., Eaton, D. K., Kann, L., Grunbaum, J. A., Gross, L. A., Kyle, T. M., & Ross, J. G. (2006). The association of survey setting and mode with self-reported health risk behaviors among high school students. Public Opinion Quarterly, 70, 354-374.
Center for Behavioral Health Statistics and Quality. (2012). Results from the 2011 National Survey on Drug Use and Health: Summary of national findings (HHS Publication No. SMA 12-4713, NSDUH Series H-44). Rockville, MD: Substance Abuse and Mental Health Services Administration.
Gfroerer, J., Wright, D., & Kopstein, A. (1997). Prevalence of youth substance use: The impact of methodological differences between two national surveys. Drug and Alcohol Dependence, 47, 19-30.
Grucza, R. A., Abbacchi, A. M., Przybeck, T. R., & Gfroerer, J. C. (2007). Discrepancies in estimates of prevalence and correlates of substance use and disorders between two national surveys. Addiction, 102, 623-629.
Hennessy, K. H., & Ginsberg, C. (Eds.). (2001). Substance use survey data collection methodologies and selected papers [Special issue]. Journal of Drug Issues, 31(3), 595-808.
Miller, J. W., Gfroerer, J. C., Brewer, R. D., Naimi, T. S., Mokdad, A., & Giles, W. H. (2004). Prevalence of adult binge drinking: A comparison of two national surveys. American Journal of Preventive Medicine, 27, 197-204.
Table 1 – Alcohol Use in the Past Month among Persons Aged 18 or Older, by State: Percentages, Annual Averages Based on 2011 BRFSS and 2010-2011 NSDUH
State
2011 BRFSS (Estimate)
2011 BRFSS (95% Confidence Interval)
2010-2011 NSDUH (Estimate)
2010-2011 NSDUH (95% Confidence Interval)
P Value
NOTE: NSDUH estimates along with 95 percent Bayesian confidence (credible) intervals are based on a survey-weighted hierarchical Bayes estimation approach and are generated by Markov Chain Monte Carlo techniques. BRFSS estimates are based on a survey-weighted direct estimation approach.
NOTE: The p value is the probability of no difference between the BRFSS and NSDUH estimates.
Source: SAMHSA, Center for Behavioral Health Statistics and Quality, National Survey on Drug Use and Health, 2010-2011 (2010 Data — Revised March 2012); Centers for Disease Control and Prevention (CDC), Behavioral Risk Factor Surveillance System, 2011.
Alabama
41.3
(39.6 - 43.0)
46.48
(43.00 - 50.00)
0.009
Alaska
58.2
(55.7 - 60.6)
58.63
(54.76 - 62.40)
0.852
Arizona
56.5
(54.1 - 58.9)
52.67
(48.65 - 56.67)
0.108
Arkansas
42.1
(39.7 - 44.5)
43.84
(40.19 - 47.56)
0.436
California
57.1
(56.0 - 58.2)
53.91
(51.90 - 55.90)
0.006
Colorado
64.3
(63.0 - 65.5)
66.15
(62.62 - 69.51)
0.327
Connecticut
64.3
(62.5 - 66.0)
66.09
(62.49 - 69.52)
0.376
Delaware
59.5
(57.4 - 61.5)
58.77
(55.05 - 62.39)
0.734
District of Columbia
67.4
(65.3 - 69.6)
66.19
(62.51 - 69.69)
0.572
Florida
56.9
(55.4 - 58.3)
54.51
(52.51 - 56.49)
0.056
Georgia
50.8
(49.2 - 52.4)
50.49
(47.02 - 53.96)
0.875
Hawaii
53.1
(51.4 - 54.9)
51.38
(47.66 - 55.09)
0.412
Idaho
48.9
(46.9 - 51.0)
53.45
(49.77 - 57.10)
0.034
Illinois
60.7
(58.8 - 62.6)
59.64
(57.61 - 61.64)
0.454
Indiana
51.6
(50.1 - 53.2)
55.32
(51.66 - 58.93)
0.067
Iowa
60.6
(59.2 - 62.1)
58.00
(54.39 - 61.53)
0.184
Kansas
51.6
(50.6 - 52.5)
55.88
(52.26 - 59.44)
0.025
Kentucky
43.1
(41.5 - 44.7)
43.49
(39.92 - 47.12)
0.848
Louisiana
49.6
(48.1 - 51.2)
50.89
(47.57 - 54.19)
0.491
Maine
60.5
(59.3 - 61.6)
58.60
(54.86 - 62.24)
0.333
Maryland
57.8
(56.3 - 59.4)
59.37
(55.58 - 63.05)
0.450
Massachusetts
64.5
(63.4 - 65.7)
67.58
(64.16 - 70.83)
0.093
Michigan
57.6
(56.2 - 59.1)
58.01
(56.08 - 59.92)
0.740
Minnesota
63.6
(62.4 - 64.8)
64.29
(60.78 - 67.66)
0.710
Mississippi
42.1
(40.6 - 43.6)
43.71
(40.40 - 47.07)
0.388
Missouri
52.5
(50.7 - 54.3)
53.59
(50.06 - 57.08)
0.588
Montana
58.7
(57.2 - 60.2)
64.33
(60.93 - 67.59)
0.003
Nebraska
61.8
(60.9 - 62.7)
57.64
(54.00 - 61.20)
0.026
Nevada
57.0
(54.5 - 59.5)
58.34
(54.27 - 62.30)
0.580
New Hampshire
65.8
(64.1 - 67.5)
66.04
(62.29 - 69.59)
0.908
New Jersey
61.4
(60.1 - 62.6)
61.01
(57.32 - 64.57)
0.841
New Mexico
51.0
(49.5 - 52.4)
46.17
(42.49 - 49.90)
0.018
New York
60.1
(58.5 - 61.7)
58.84
(56.82 - 60.84)
0.337
North Carolina
48.0
(46.4 - 49.5)
52.96
(49.25 - 56.63)
0.016
North Dakota
62.4
(60.7 - 64.2)
63.28
(59.71 - 66.70)
0.662
Ohio
55.9
(54.4 - 57.3)
56.68
(54.76 - 58.59)
0.524
Oklahoma
45.6
(44.1 - 47.2)
48.10
(44.55 - 51.67)
0.207
Oregon
59.4
(57.6 - 61.2)
64.42
(60.90 - 67.79)
0.013
Pennsylvania
57.2
(55.8 - 58.5)
58.79
(56.79 - 60.75)
0.196
Rhode Island
62.5
(60.8 - 64.2)
66.17
(62.40 - 69.76)
0.081
South Carolina
47.0
(45.6 - 48.5)
52.09
(48.43 - 55.72)
0.011
South Dakota
58.8
(56.7 - 60.9)
60.00
(56.34 - 63.55)
0.575
Tennessee
37.5
(34.7 - 40.3)
44.70
(41.09 - 48.36)
0.002
Texas
54.3
(52.8 - 55.8)
54.18
(52.20 - 56.15)
0.923
Utah
29.5
(28.4 - 30.6)
27.79
(24.57 - 31.26)
0.349
Vermont
65.1
(63.5 - 66.6)
64.49
(60.91 - 67.91)
0.754
Virginia
56.0
(54.1 - 57.8)
58.90
(55.17 - 62.52)
0.171
Washington
57.9
(56.5 - 59.2)
61.48
(57.81 - 65.01)
0.072
West Virginia
31.8
(30.2 - 33.5)
41.18
(37.70 - 44.76)
0.000
Wisconsin
67.1
(65.0 - 69.2)
67.49
(63.81 - 70.97)
0.853
Wyoming
54.0
(52.2 - 55.8)
54.23
(50.57 - 57.84)
0.913
Table 2 – Cigarette Use among Persons Aged 18 or Older, by State: Percentages, Annual Averages Based on 2011 BRFSS and 2010-2011 NSDUH
State
2011 BRFSS1 (Estimate)
2011 BRFSS1 (95% Confidence Interval)
2010-2011 NSDUH2 (Estimate)
2010-2011 NSDUH2 (95% Confidence Interval)
NOTE: NSDUH estimates along with 95 percent Bayesian confidence (credible) intervals are based on a survey-weighted hierarchical Bayes estimation approach and are generated by Markov Chain Monte Carlo techniques. BRFSS estimates are based on a survey-weighted direct estimation approach. 1 BRFSS respondents were classified as current smokers if they reported having smoked at least 100 cigarettes during their lifetime and indicated that they smoked every day or some days at the time of the survey. 2 NSDUH respondents were classified as past month cigarette users if they smoked all or part of a cigarette during the past 30 days.
Source: SAMHSA, Center for Behavioral Health Statistics and Quality, National Survey on Drug Use and Health, 2010-2011 (2010 Data Revised March 2012); Centers for Disease Control and Prevention (CDC), Behavioral Risk Factor Surveillance System, 2011.
Alabama
24.3
(22.9 - 25.8)
28.80
(25.95 - 31.81)
Alaska
22.9
(20.9 - 25.0)
30.01
(26.68 - 33.56)
Arizona
19.2
(17.2 - 21.1)
24.75
(21.67 - 28.12)
Arkansas
27.0
(24.8 - 29.1)
29.04
(25.94 - 32.35)
California
13.7
(12.9 - 14.4)
18.03
(16.65 - 19.49)
Colorado
18.3
(17.2 - 19.3)
23.63
(20.91 - 26.59)
Connecticut
17.1
(15.7 - 18.5)
22.97
(20.29 - 25.89)
Delaware
21.8
(19.9 - 23.6)
26.02
(23.16 - 29.10)
District of Columbia
20.8
(18.7 - 22.8)
24.39
(21.60 - 27.41)
Florida
19.3
(18.2 - 20.4)
23.40
(21.81 - 25.06)
Georgia
21.2
(19.9 - 22.5)
22.19
(19.47 - 25.18)
Hawaii
16.8
(15.4 - 18.2)
21.40
(18.76 - 24.30)
Idaho
17.2
(15.5 - 18.9)
24.33
(21.48 - 27.42)
Illinois
20.9
(19.2 - 22.7)
23.88
(22.34 - 25.49)
Indiana
25.6
(24.3 - 27.0)
27.25
(24.46 - 30.23)
Iowa
20.4
(19.1 - 21.6)
25.22
(22.55 - 28.09)
Kansas
22.0
(21.2 - 22.8)
25.53
(22.77 - 28.51)
Kentucky
29.0
(27.5 - 30.5)
33.40
(30.14 - 36.82)
Louisiana
25.7
(24.3 - 27.1)
28.96
(26.23 - 31.85)
Maine
22.8
(21.7 - 23.9)
26.53
(23.63 - 29.65)
Maryland
19.1
(17.8 - 20.4)
20.82
(18.33 - 23.55)
Massachusetts
18.2
(17.3 - 19.2)
20.13
(17.70 - 22.81)
Michigan
23.3
(22.0 - 24.6)
28.17
(26.58- 29.81)
Minnesota
19.1
(18.1 - 20.1)
23.50
(20.92 - 26.29)
Mississippi
26.0
(24.6 - 27.3)
28.99
(26.13 - 32.04)
Missouri
25.0
(23.4 - 26.6)
28.64
(25.81 - 31.64)
Montana
22.1
(20.8 - 23.4)
25.67
(23.04 - 28.49)
Nebraska
20.0
(19.3 - 20.7)
24.80
(22.08 - 27.73)
Nevada
22.9
(20.9 - 24.9)
24.43
(21.42 - 27.71)
New Hampshire
19.4
(18.0 - 20.9)
23.27
(20.58 - 26.19)
New Jersey
16.8
(15.9 - 17.7)
24.41
(21.50 - 27.57)
New Mexico
21.5
(20.3 - 22.7)
22.47
(19.72 - 25.49)
New York
18.1
(16.9 - 19.4)
22.26
(20.79 - 23.80)
North Carolina
21.8
(20.5 - 23.1)
26.25
(23.36 - 29.36)
North Dakota
21.9
(20.3 - 23.5)
23.91
(21.26 - 26.77)
Ohio
25.1
(23.8 - 26.4)
28.38
(26.79 - 30.02)
Oklahoma
26.1
(24.7 - 27.5)
31.02
(27.77 - 34.46)
Oregon
19.7
(18.3 - 21.2)
23.73
(21.03 - 26.66)
Pennsylvania
22.4
(21.3 - 23.6)
25.75
(24.19 - 27.37)
Rhode Island
20.0
(18.6 - 21.5)
25.65
(22.88 - 28.62)
South Carolina
23.1
(21.9 - 24.4)
28.77
(25.76 - 31.99)
South Dakota
23.0
(21.1 - 25.0)
26.07
(23.19 - 29.16)
Tennessee
23.0
(20.6 - 25.4)
29.52
(26.33 - 32.91)
Texas
19.2
(18.0 - 20.4)
23.21
(21.69 - 24.81)
Utah
11.8
(11.0 - 12.7)
14.84
(12.65 - 17.33)
Vermont
19.1
(17.7 - 20.5)
23.80
(21.21 - 26.61)
Virginia
20.9
(19.4 - 22.5)
21.41
(18.91 - 24.14)
Washington
17.5
(16.4 - 18.6)
24.16
(21.49 - 27.05)
West Virginia
28.6
(27.0 - 30.2)
32.14
(29.09 - 35.35)
Wisconsin
20.9
(19.1 - 22.7)
23.35
(20.64 - 26.30)
Wyoming
23.0
(21.5 - 24.6)
25.14
(22.25 - 28.28)
Figure 1 Alcohol Use in the Past Month among Persons Aged 18 or Older, by State: Percentages, Annual Averages Based on 2011 BRFSS
6 The eight most populous States (California, Florida, Illinois, Michigan, New York, Ohio, Pennsylvania, and Texas) are referenced as the "large" States in this document.
 , and
, and